
In this article we take a look a bit deeper into what you can see from your dynograph.
Here you can see a basic dynograph from stock VAG 1,8t 4-cyl turbo petrol engine. It produces 148hp and 223 Nm at engine. The graph is nice and smooth without anything special right? But if we look at the lower graph we see a bit bumpy blue line, what is that? It is the torque value from the front right hub with less filtering. Why is it not smooth like the engine torque is? It is because of the level of filtering of the signal.
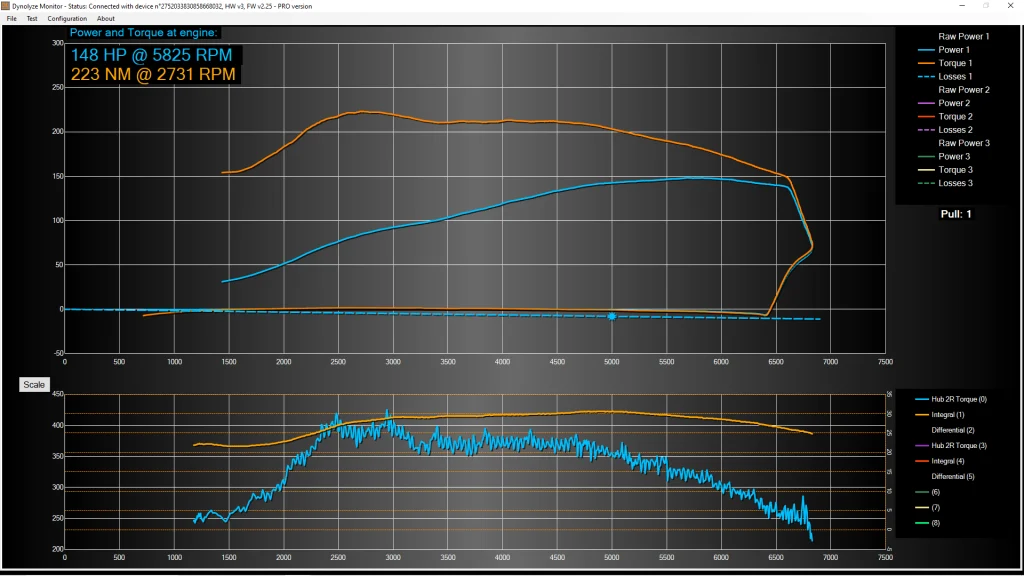
Combustion engine and manual gearbox driveline is full of vibrations because on the engine side we have compression strokes and power strokes. Compression stroke tries to slow down the crankshaft and power stroke tries to accelerate it. That is why we have vibration and the frequency depends on the engine speed (RPM).
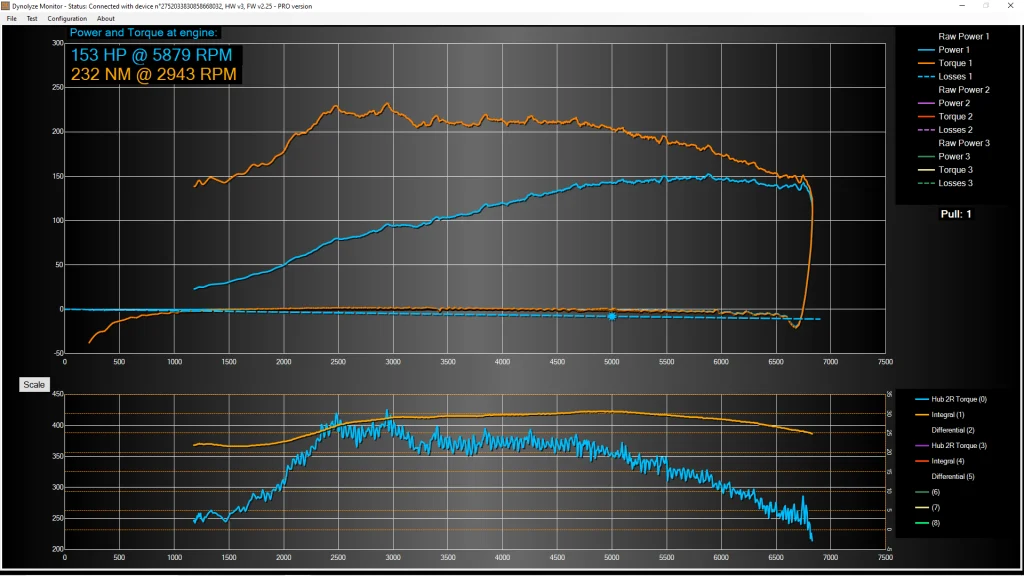
Then we have gearbox where we have free play between gears etc. and that will add its own part of this “noise”. Car manufacturers try to hide/smooth it out for example by using dual mass flywheel, rubber engine mounts etc. to make it less recognizable. But even though we cannot feel it, it doesn’t mean that it is not there. Here is the same pull with less filtering level in the software.
So back to graph. We need to filter the signals to make the graphs easier to read, that is why dyno filters “out” those vibrations. But why can’t we just filter all the signals and forget the subject then? Because in some cases we want to see rapid changes in our curves. Here is an example from the same car when we caused a cylinder number one misfire for few engine cycles.
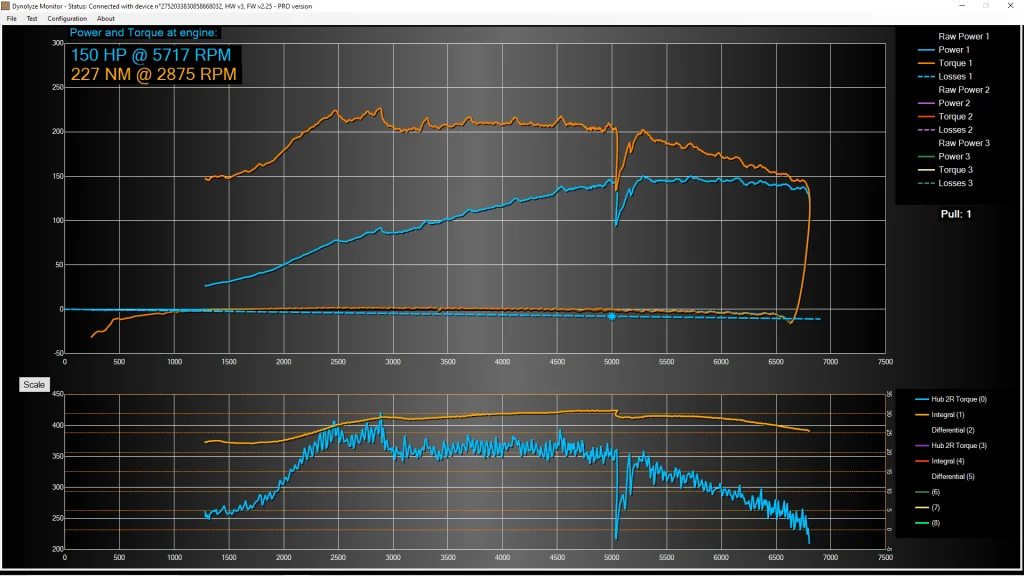
We can clearly see that power and torque drops at 5000 RPM but why? It’s because of the misfires in cylinder number one, there is no spark in the cylinder and we totally lost the torque from that cylinder. If we look at the graph we can see that torque is about 200 Nm before the misfire happens. Then we can see that the torque drops from 200 Nm to 150 Nm and that is because we have 4-cyl engine with 200 Nm so every cylinder produces around 50 Nm and while the misfire is happening there is only 3 cylinders producing the torque.
Do we want to see that kind of change in the dynograph? Sure we do! Or do we want to filter it out from the data? Hell no! So can you hide it if you add more filtering? Well the change in the engine is so huge that our filtering won’t be able to hide it completely but if we look at the same graph with more filtering, we still see the dip but it doesn’t look that bad anymore.

So, will all the dynos show us the same kind of graphs?
If we think of the most basic chassis dyno that is inertia roller dyno. It has a huge steel roller and a speed sensor and it measures the acceleration of that roller and calculates the power and torque from the acceleration of that roller mass. But you can imagine if you have a steel roller that weights like 500 kg and you change the torque of the car really rapidly from 200 Nm to 150 Nm and then back to 200 Nm, what happens? Not a lot because the rolling mass is so high that it can’t change the acceleration rate very fast and it kind of “filters” those fast changes naturally. That is why many piston engines have flywheels, like we talked about earlier, to try to dampen the vibrations and make things more smooth. That is why inertia dynos are not known to be “sensitive” dynos.
Then we have a roller dyno with retarders and loadcells. Loadcell is a device that measures brake force and they are fast and sensitive sensors. With this kind of dyno when we accelerate we need to accelerate rollers mass like in pure inertia dyno, but on top of that we can control acceleration rate of the roller via the retarder. We can even do steady-state, which means the dyno holds a constant speed. At steady-state we don’t use power to accelerate the roller and all of our power is measured via load cell. But when doing steady-state we still have these steel rollers (usually not as heavy as in pure inertia dyno but still significantly heavy parts) and they act like flywheels and smooths out fast changes.
And most common dyno pull is “sweep” test where we set an acceleration rate that we want the dyno to follow. For example 500 engine rpm / sec or 20 kmh / sec or what ever but then we accelerate rollers and retarder try to adjust that acceleration to follow our set acceleration speed. In that situation we are using our engine power to accelerate rollers and the moving parts of the retarders and on top of that the brake slows down our acceleration and some of our power goes thru that load cell.
So a braked roller dyno is a combination of inertia and brake-controlled dyno. Again this amount of inertia makes the dyno not accurate at rapid changes but some power goes through the loadcell and the loadcell is fast so we can see something but not all of it.
Ok so now we know what is inertia, retarder, loadcell and how they act. Why hub dynos are known to be “sensitive”?
Like we learnt inertia is kind of the enemy if we want to see fast changes. In hub dyno we don’t have any rollers with mass and we even take tires out from the car (tires act like small flywheels). A hub dyno with eddy current retarders measures 90-100% of torque via loadcell and that is why it can spot easily fast torque / power changes.
But why it’s not 100% of power what goes thru load cells all the time? Because we still have small inertia in hub dyno also, it comes from the car itself and the retarders, but it’s nothing compared to big steel rollers. When we do steady state in hub dyno 100% of power goes through loadcells and we don’t have those huge rollers act like flywheels. In sweep test inertia is so low that basically the brakes are controlling the acceleration rate by themselves and 95-98% of power goes through loadcells and that is why it can see small torque changes almost perfectly.
In the last picture we can see our brake duty and both front hub torques, we see that brake duty drops from 30% to 20% exactly at the same moment when misfire occurs.
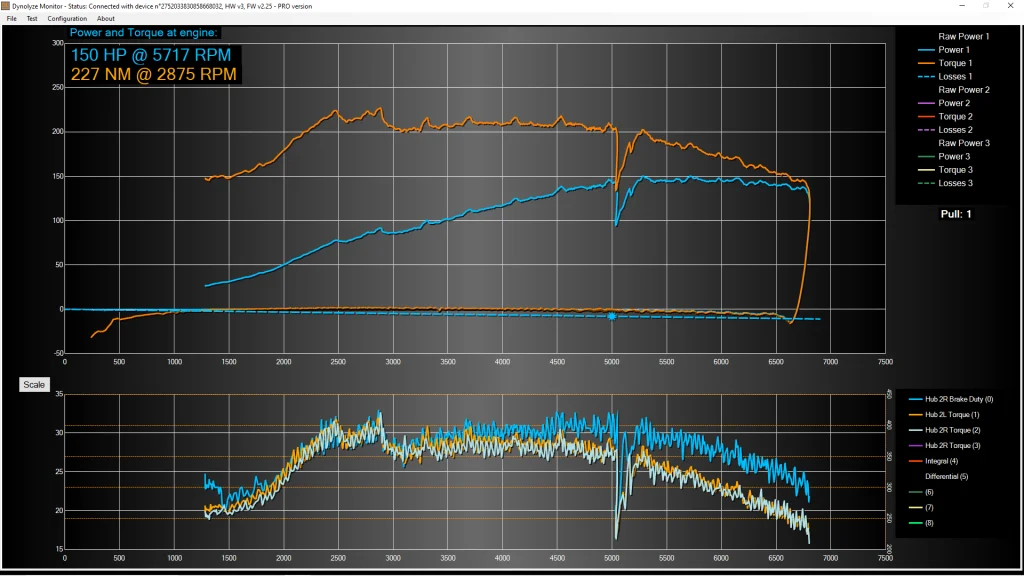
That’s because we lost 25% of our torque what accelerates our dyno and like we know in an eddy current braked hub dyno, when doing a sweep test, the dyno controls our acceleration rate with the brakes and it needs to use less brakes to maintain our acceleration rate with less power. All of this is happening in less than 0.05 sec because of low inertia….
And we want to say that we don’t mean that some dyno type is bad or good they just act differently because of the physics and we want you to understand more how the dynos work and what kind of dyno suits for what kind of jobs.